
Are you struggling to say how much you actually made from the delivery apps last month? Watching sales go up while the bank balance doesn't follow? Opening three portals and getting three different stories? Or only looking at the numbers when something already feels wrong?
That prospect's line has stuck with me because nearly every owner says some version of it. Nobody was stealing from him. His sales were real, and so were the promos, ads, offer fees and error charges coming out before the payout. He'd just never seen them side by side, month after month.
I've already covered how to read a single statement and what a good payout ratio looks like. This post is about the habit: one sheet, once a month, every platform, and how to read it.
Quick answers and quick fixes
- Don't know when to check? Pick a day early in the month, like the 5th. DoorDash's monthly statements are ready by then.
- Comparing weeks? Stop. Use full calendar months. Weekly payouts straddle months, and Uber's week closes on Sunday night.
- Only tracking sales? Put payout and payout ratio on the same row, every month.
- Payout ratio dropped? Find the cost line that grew faster than sales. It's usually promos, ads or errors.
- Three apps, three formats? Log the same ten numbers for each, in the same order.
- Last few days of DoorDash look off? They're often still estimates. Mark them and recheck next month.
Why can't I tell where my delivery money goes?
Because the apps don't make it easy. Each one uses its own names for the same costs, closes its pay week on its own clock, and leads with sales on the dashboard. The payout is a click or two deeper. A single order can pay you anywhere from 20 to 80 cents on the dollar, which makes it look random if you only look at one at a time. Over a full month, they all meet in the middle.
The other reason is timing. Most owners look when something feels off. By then it's two or three months of a promo that stacked, an ad budget a rep raised, or error charges nobody disputed. A monthly check catches it in the first month.
What should I track every month?
Ten numbers per platform. The first nine come off the statement or export. The last one you work out.
| Row | What it is | Why it's on the sheet |
|---|---|---|
| Sales | Food sales before tax and tips (DoorDash "Subtotal," Uber "Sales (excl. tax)") | Everything else is measured against it. |
| Orders | Number of orders | Tells you if growth came from more orders or bigger ones. |
| Average order | Sales ÷ orders | Spend-and-save offers should push this up. |
| Commission | The plan's cut (Uber calls it the marketplace fee) | Should be steady. If it moves, your plan or order mix changed. |
| Promotions | Discounts you funded, plus offer fees | Usually the biggest swing line. |
| Ads | Sponsored listings and Uber Eats ads | Should move only when you chose to move it. |
| Errors | Error charges and refunds, minus disputes won | Money you might get back, and a sign of kitchen issues. |
| Other | Adjustments, credits and anything else | So the sheet adds up to the payout. |
| Payout | What actually hit the bank for that month's orders | The number your rent gets paid from. |
| Payout ratio | Payout ÷ sales | The one number that sums up everything above it. |
Add two numbers from your POS once a month: your in-store average ticket and total store sales. Payout per order (payout ÷ orders) next to your in-store ticket tells you how the apps compare with a walk-in. Delivery sales ÷ total store sales tells you how much of the business the apps really are.
How do I build the sheet?
Google Sheets or Excel, either works. It takes about 20 minutes a month once it's set up.
- Set up the rows. One block per platform with the ten rows above, one column per month, and a combined block at the bottom that adds the platforms together.
- Pull DoorDash. In the Merchant Portal, open Financials, then Statements. Monthly statements are available by the 5th (DoorDash Help). For order-level detail, go to Reports, then Create report, and pick Financial Report. Add a day on each side of the month so no orders fall off the edges, then filter to the month (DoorDash).
- Pull Uber Eats. In Uber Eats Manager, open Payments, click Download CSV and pick Payment Details. It covers up to 31 days, so set it to the calendar month and add up each column (Uber Help).
- Pull Grubhub. Log in at restaurant.grubhub.com with an admin account and note sales and payout. Check that the deposits actually arrived. I once found $996 sitting unpaid on a Grubhub account because direct deposit wasn't set up.
- Work out the percentages. Each cost line as a share of sales, the payout ratio, and payout per order.
- Write one line per platform. What changed this month and why. Note any change you made too: a new BOGO, a higher ad budget, a menu edit. If you change two things at once, you won't be able to tell which one moved the numbers.
A shortcut I use: take a screenshot or export of each month and have an AI assistant do the month-over-month math. Check its totals against the statement once, then let it do the grunt work.
Two traps. DoorDash payouts for the last few days of a month are often still estimates when you pull them, so flag those and update them next month. And if Uber is holding back 24% of your money, that's tax withholding from a missing W-9, which I explain in the statement post.
How do I read the sheet month to month?
Read it top to bottom, one platform at a time, and look for the row that changed the most as a share of sales.
- Sales up, payout up by more: the best month you can have. "Payout increasing by more than the sales increasing is actually a positive indicator of profitable sales."
- Sales up, payout ratio down: normal in a growth phase, as long as payout dollars still grew. If payout dollars fell, check the promotions row first. Two offers hitting the same customers is the usual cause.
- Commission moved: it shouldn't. Check if your plan changed. On Uber's Plus plan, orders from Uber One members are charged 30% instead of 25%, so more members means a bit more commission.
- Ads row jumped: find out who changed the budget, and what it returned.
- Errors row climbed: look at which items and which days, and dispute what wasn't your fault. Under 2% of orders is normal.
- Sales and payout both down: check what changed before you react. A campaign that ended, store hours, ratings, or a planned pull-back on promos. Write the reason next to the month so nobody panics about it later.
For what each payout ratio band means, see how much delivery revenue you actually keep. For every cost line in detail, including the food cost of a BOGO that never shows on a statement, see the true cost of selling on the apps.
Example: what does the sheet catch?
Three months on one app, simplified. Promos started in February and got bigger in March.
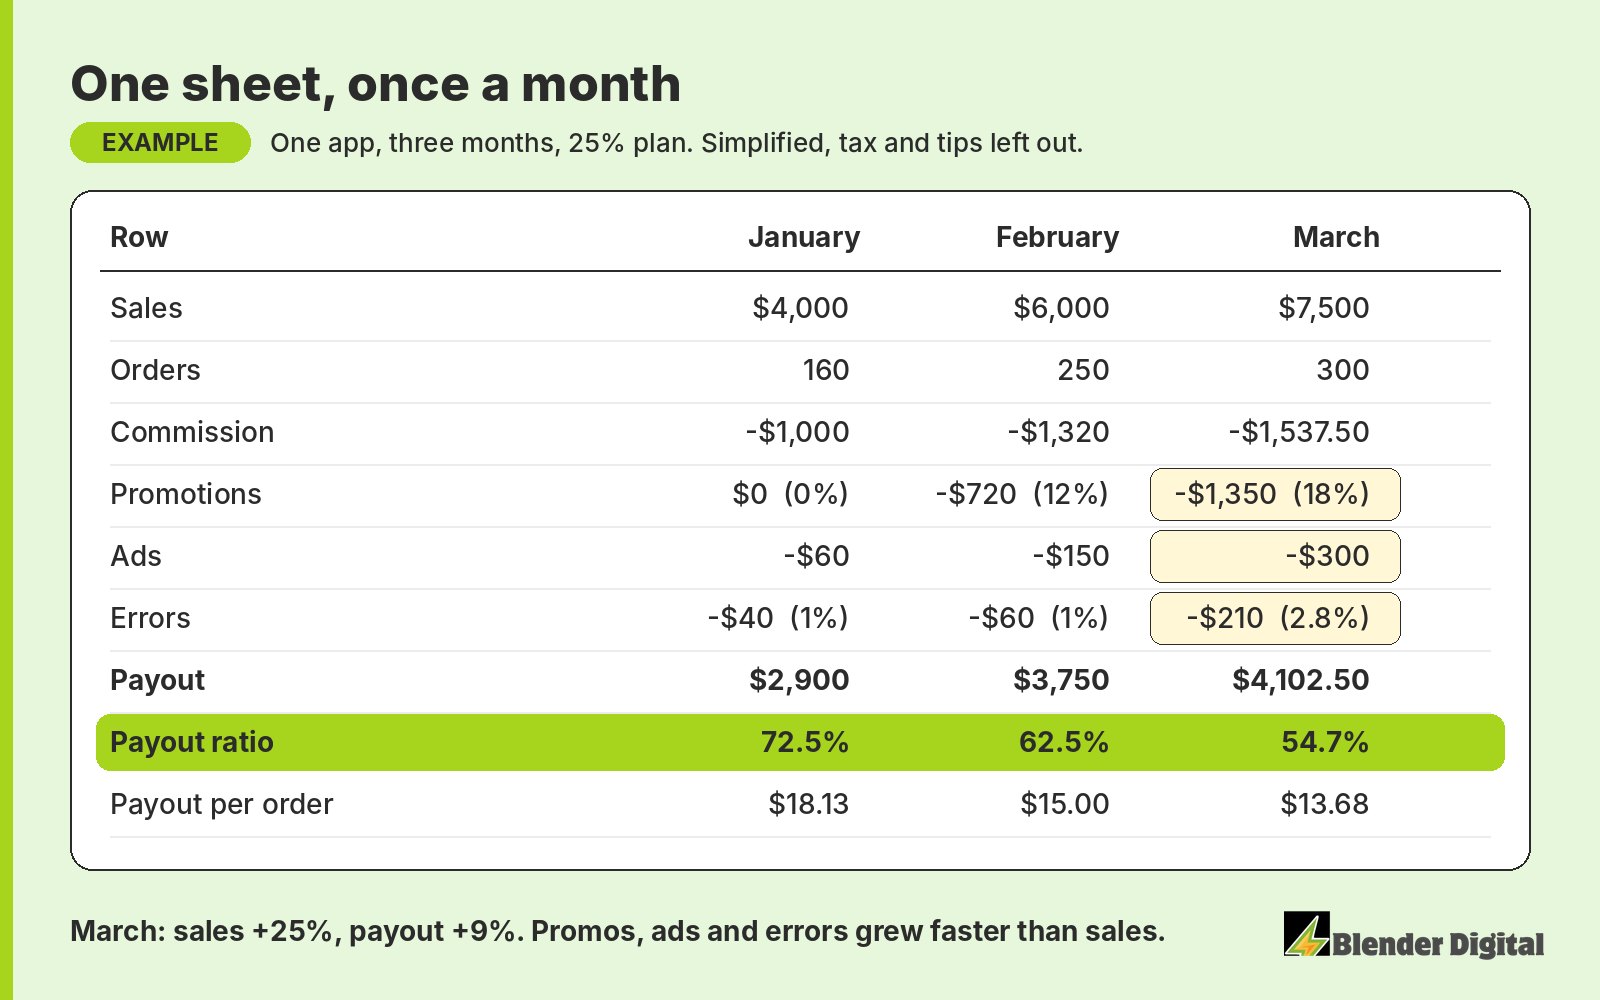
Look at March. Sales grew 25% over February, but payout only grew about 9%. The sheet shows why in one glance: promotions went from 12% of sales to 18%, ads doubled, and error charges jumped from 1% of sales to almost 3%. Without the sheet, all the owner sees is a good sales month and a payout that feels light.
None of that is a disaster. The promos might be bringing in new customers, which is their job. But the errors row is money worth chasing this week, and the ad spend needs a reason. That's what the sheet is for.
How does Blender track delivery money for clients?
We do this sheet for every client, every month, and walk the owner through it live. The monthly report has goals against actuals, then sales, orders, average order, payout and payout ratio for each platform, plus unit economics, reviews, and errors and disputes. Between reports, each client has a dashboard that shows sales and payout pacing against the month's goal, and Monday emails cover reviews and error charges. That's our reporting and dashboards work.
Here's what the breakdown looks like on a real report. At a fast-casual franchise in New Jersey (burgers, sandwiches and wings), September 2026 was the first month we managed. Sales came in at $19,592 against a $15,000 goal, at a 63.2% payout ratio, across Uber Eats, DoorDash and Grubhub. The report split each platform's dollar: on Uber Eats, 36 cents of every sales dollar went to offers and ads and 10 cents to Uber's fees on that store's plan, while DoorDash paid out 74.8%. That one line told the owner where the growth was being paid for, and where to look first when it's time to shift toward profit.
When the errors row is the leak, we review every error charge daily and prepare the disputes for you to submit. More on our dispute management page.
If you'd rather not build the sheet yourself, send us last month from each app. Blender's here to help. Book a free 30-minute call and we'll fill it in with you.
FAQ
How do I track my DoorDash and Uber Eats payouts each month?
Once a month, pull the monthly statement from DoorDash (Financials, then Statements) and the Payment Details export from Uber Eats (Payments, then Download CSV). Log sales, orders, commission, promotions, ads, errors, other adjustments and payout for each app, then divide payout by sales.
What numbers should a restaurant track from delivery apps?
Sales, orders, average order, commission, promotions, ads, errors, other adjustments, payout and payout ratio, per platform and per full calendar month. Add your in-store average ticket so you can compare it with payout per order.
Why did my delivery sales go up but my payout didn't?
Something grew faster than sales. It's usually promotions, especially two offers hitting the same customers, a higher ad budget or more error charges. Put each cost line as a share of sales next to last month's and the one that jumped is your answer.
How often should I check my delivery app payouts?
Do the full sheet once a month, on full calendar months. Check error charges much more often, because DoorDash only lets you dispute in the portal for 14 days.
Is there a simple template for tracking delivery payouts?
One block per platform with ten rows (sales, orders, average order, commission, promotions, ads, errors, other, payout, payout ratio), one column per month, and a combined block that adds the platforms together.