
DoorDash calls a 3.5x return on ad spend "excellent." On Uber Eats, I stop adding budget once an ad is down around 6x. Same idea, two different formulas, and owners mix them up all the time.
That's most of the trouble with delivery dashboards. The numbers are all there. What's missing is what a good number looks like and what to do when yours isn't one. These are the metrics I check on every DoorDash and Uber Eats account we manage, with the benchmarks I use, in the order I read them.
Which delivery metrics actually matter?
Payout ratio comes first. Everything else on the dashboard explains why it moved. After that I group the rest into four buckets: sales (orders, average order value, online share), marketing (ad ROAS, BOGO return, the ad funnel), the storefront (conversion and customer mix), and reputation (rating, reviews and errors).
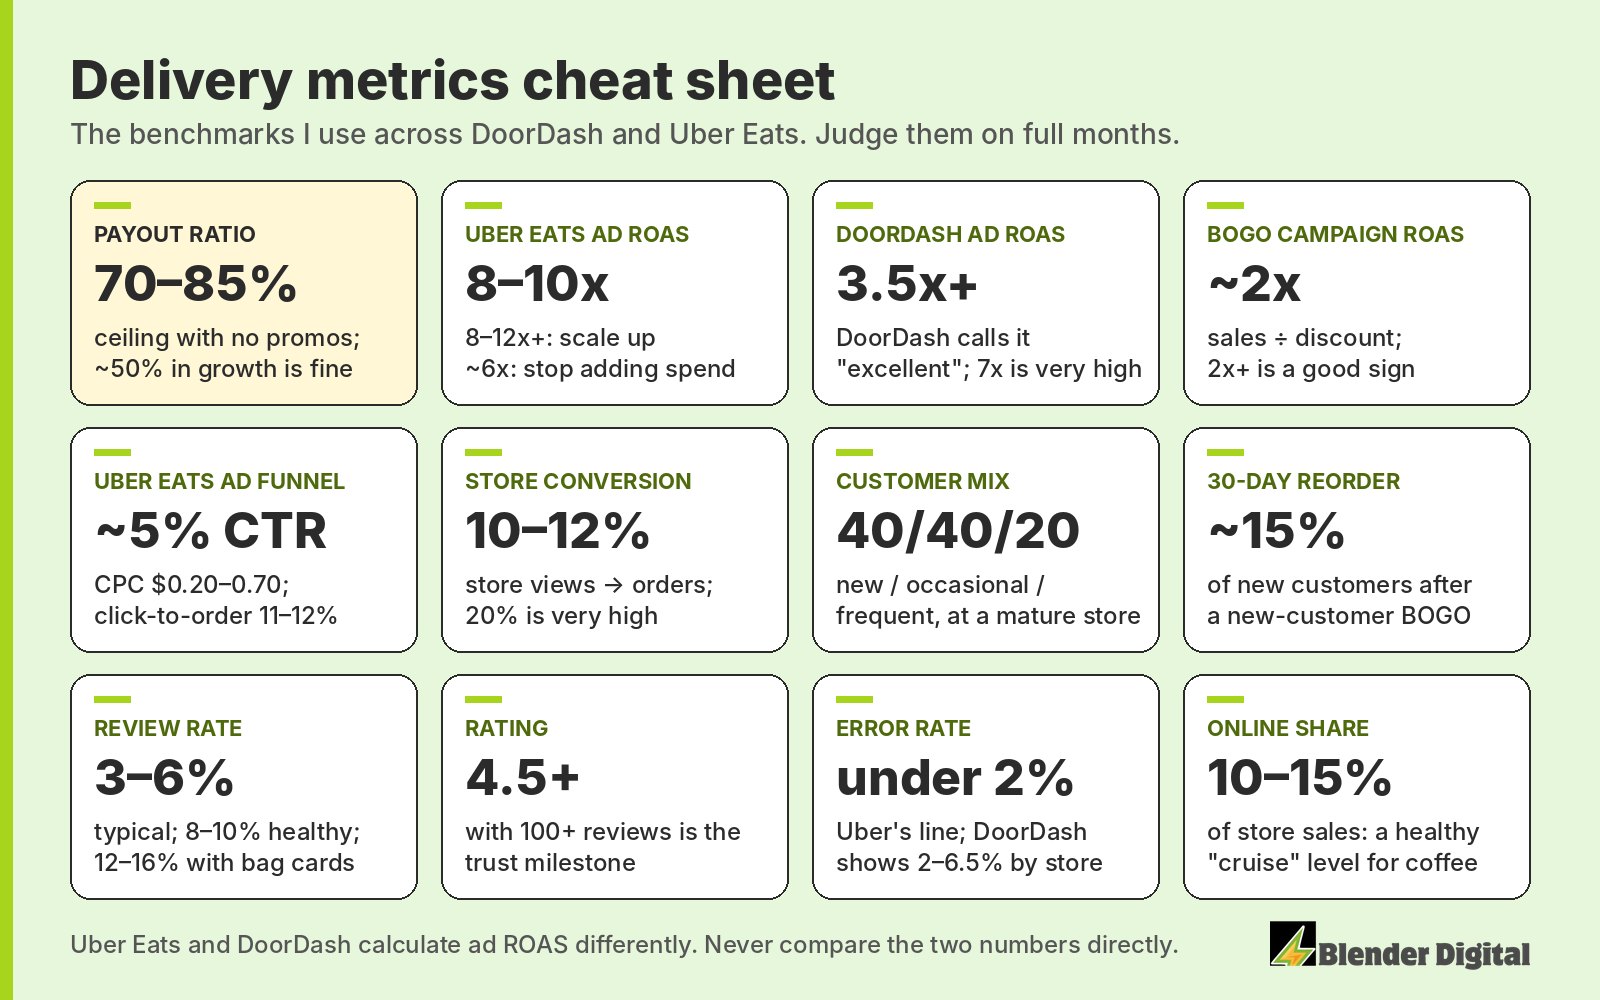
Sales, orders, AOV and payout ratio
When sales go up, split the growth in two: more orders, or bigger orders. Those need different fixes. More orders usually comes from visibility and new-customer offers. A bigger average order comes from bundles, paid add-ons and spend-and-save thresholds set a little above your current average.
Then check payout ratio, which is net payout divided by gross sales. With no promos you'll land around 70–85%. About 50% is normal in a growth phase, and 20–30% is a problem. I wrote a full guide on how to calculate payout ratio and what a good one looks like, so I won't repeat it here. One thing to watch: if payout is growing faster than sales, that's a good sign. It means the new sales are profitable ones.
The last sales number I track is online share, meaning third-party sales divided by the whole store's sales. For a coffee shop, 10–15% is a healthy level to cruise at, and 18–20% is very aggressive. At an Arab coffee bar in New Jersey, delivery went from 9.83% of the store's sales in February 2026 to 20.9% in May.
How do you read ROAS on Uber Eats vs DoorDash?
Uber Eats shows ad return as sales per $1 of spend. 8–10x is healthy. At 8–12x or higher, I raise spend, 10–20% at a time, and let it settle before the next move. Under 8x I hold. Around 6x, you shouldn't be spending more.
DoorDash calculates it its own way. Over 3.5x is what DoorDash calls "excellent," under 2.5x is "fair," and 7x is very high. Sponsored listings on DoorDash are paid per order, not per click. They also go stale if you leave them at the same budget for months, so I nudge the budget a little each month.
Here's a taco shop on Long Island from August to September 2026. Uber Eats ad return went from 5.92x to 8.92x, and the DoorDash sponsored listing went from $4.29 to $5.63 in sales per $1. Keep in mind the Uber number is Uber's own attribution. It counts any order from a customer who saw the ad, so it overlaps with sales from your other offers.
On Uber Eats you can also see the funnel behind the ad. A click-through rate around 5% is typical, cost per click runs $0.20–0.70, and 11–12% click-to-order is healthy. So adding $5 a day at a $0.20 cost per click buys about 25 clicks, and at 12% that's about 3 more orders a day.
How do you know if a BOGO is working?
Divide the campaign's sales by what the discount cost you. About 2x is normal for a BOGO. Above 2x means customers are buying more than just the BOGO item.
At a fast-casual franchise in New Jersey (burgers, sandwiches, wings), the first-order BOGO on Uber Eats brought in 189 new customers in September 2026, with $8,858 in sales on $3,465 of offer cost. That's $2.56 back for every $1.
That BOGO was for new customers only, on purpose. I'd rather spend to win a customer than to buy one more order, and a new customer can only be a new customer to your store once. Before you launch one, run the items through the BOGO profit calculator. Alongside the return, watch customer mix (new, occasional and frequent). A mature store sits around 40/40/20. A brand new store will be 85–90% new customers. After a new-customer BOGO, I expect about 15% of those new customers to reorder within 30 days.
What's a good conversion rate on DoorDash or Uber Eats?
Store conversion is orders divided by store views. Around 10–11% is healthy for a burger store, coffee runs 10–12%, and 20% is very high.
This is how I tell a traffic problem from a conversion problem. If views are low, people aren't seeing you, so look at sponsored listings and your category tags. If views are fine and conversion is low, people are seeing you and not buying. That's photos, price, descriptions and your rating. Campaigns help visibility, but conversion comes down to trust: are you at 4.5 or above, and how many reviews do you have?
Ratings, reviews and error rate
Rating. 4.5 or higher with 100+ reviews is the milestone where customers start trusting you. Volume matters too. If you have 1,000 reviews and a 4.2, that's an average store. If you have 150 reviews and a 4.5, customers are happy.
Review rate (reviews divided by orders). 3–6% is typical, 8–10% is healthy, and 12–16% is possible with review cards in the bag. Rates are low partly because the app asks customers to rate the courier first. At that New Jersey coffee bar, a printed card in the bag took Uber Eats reviews from 2 to 24 between February and March 2026, a 16.1% review rate against 4.5–6.4% at three sister stores. More on that in how to get your first 100 reviews.
Error rate (error orders divided by total orders). Uber's line is under 2%. DoorDash benchmarks I've seen range from 2% to 6.5% depending on the store. This one feeds your ranking. DoorDash measures you against your peers, and if the kitchen keeps making mistakes, the algorithm suppresses you.
How often should you check your delivery metrics?
Weekly to keep an eye on things, monthly to make decisions. The algorithm can push you one day and drop you the next, and one or two bad days isn't something to solve for. A week rarely tells the full story. A full calendar month does.
Don't trust the dashboard's "vs 7 days prior" or "same day last year" comparisons. I've seen one show 11,000% growth. Do your own month-over-month math. Remember that Monday is slow everywhere and the peak runs 6–10pm, so don't compare a Monday to a Friday. And change one thing at a time, or you'll never know which change moved the number.
What goes in a monthly delivery report?
This is the structure I use for every client, every month:
- Goals vs actual for the month
- Summary: sales, orders, average order value, payout and payout ratio
- Net profit on payout (I assume a 25–30% margin) and return on our fee
- Online share of the store's total sales
- A page per platform, plus item-level unit economics
- Reviews: count, review rate, offers redeemed
- Errors and disputes
- A recommendations tracker with an owner and a status on each item
Growth % is the headline, with the raw numbers next to it. Then I send a short TL;DR on WhatsApp, because no one ever reads decks, and walk the owner through it live.
FAQ
What are the most important DoorDash metrics?
Payout ratio first, then sales split into orders and average order value, sponsored listing return, store conversion, rating and review count, and error rate. Read them on full months, not the dashboard's 7-day comparisons.
What is a good ROAS on Uber Eats?
8–10x is healthy. At 8–12x or more, raise spend in 10–20% steps. Under 8x, hold. Around 6x, stop adding budget.
What is a good ROAS on DoorDash?
DoorDash calls over 3.5x "excellent" and under 2.5x "fair." 7x is very high. DoorDash calculates it differently from Uber Eats, so don't compare the two numbers.
What is a good review rate on DoorDash and Uber Eats?
3–6% of orders is typical and 8–10% is healthy. With a review card in the bag, 12–16% is possible.
This is the same report we build for our clients each month. If you'd like a second set of eyes on your numbers, book a free call and bring your last full month from each app.